- First Name
- Bill
- Joined
- Apr 8, 2022
- Threads
- 2
- Messages
- 152
- Reaction score
- 293
- Location
- Columbus, OH
- Vehicle(s)
- Carless
- Your Bronco Model
- Badlands
- Thread starter
- #1
Alright everyone. Bear with me...
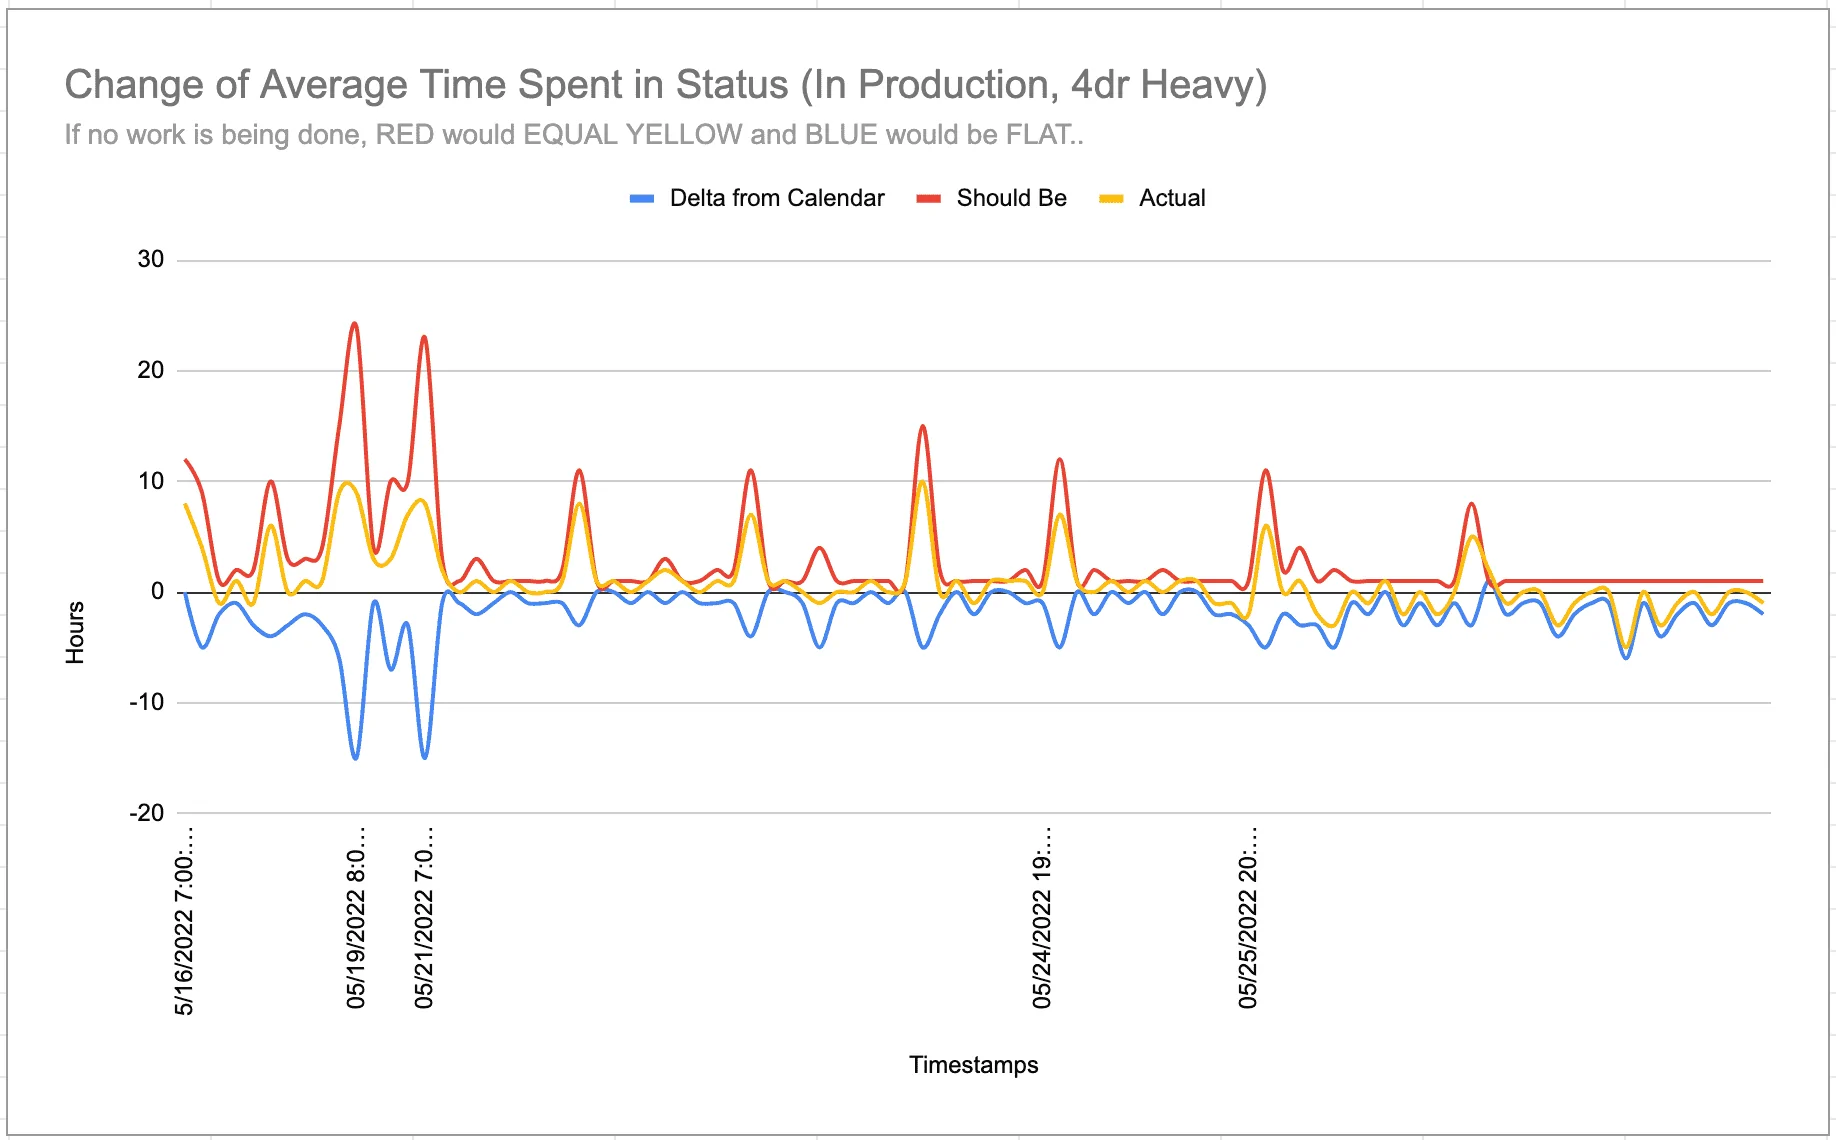
I've been watching the Order Tracker for the last week. Hourly when I can, but at least tracking around 7pm and 7am for consistency. Most people are watching the total number of vehicles in a status, but I've been watching the "Average Time" and "Max Time" (which incidentally, the date of the longest vehicle in the Tracker at this status is 4/4/2022 @ ~9pm).
My theory is, when the Broncos that have been there their longest start getting their status progressed, we will see that average time come down at a faster rate than when newer vehicles get pushed through quickly. For example, removing a Bronco that's been in for 1000h drops the overall average, but removing 10 Broncos that have each been there for 100h actually raises the average.
As I said, instead of calling/chatting with Ford for the last week, I've been watching the numbers on really the only tool we really have.
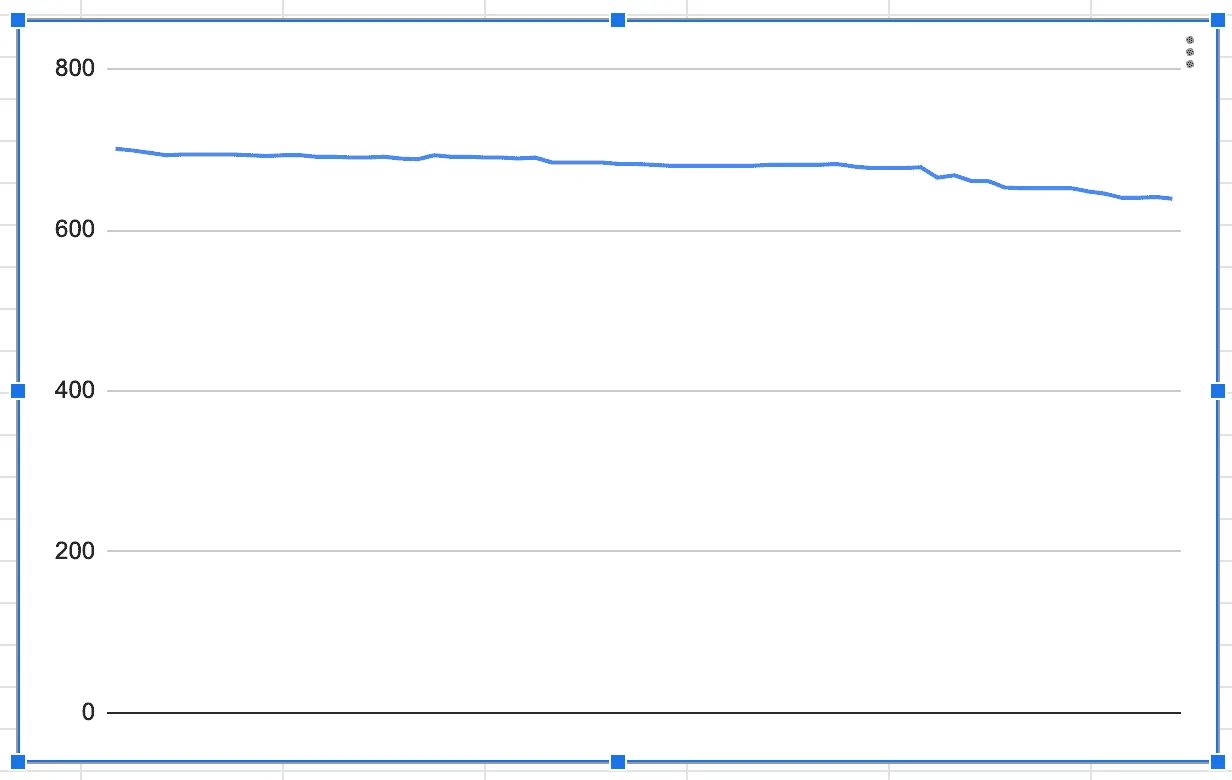
In the attached chart, ignore the stuff on the left, but focus on the green box. For the first time tonight, I saw the average spend time go down for 4h straight. I've seen for down here and there, usually an hour at a time. And if I don't watch it overnight, the data show that the rate of the increase of the average at least slows down.
As of me writing this, the current average Bronco has been in "In Production" status since 4/30/2022 at ~3:00am, so any Bronco sent to shipping before then helps the average go down.
Hopefully this means for 4h, they we getting things out the door that are in the April neck of the woods (my other April compatriots).
Note: my tracker shows "4dr > 6000 lbs Broncos". YMMV. Also, this could be complete BS as I have no idea how the tool calcs the numbers it shows us. And I have no idea how any Jan/Feb/Mar vehicles using the tool would be reflected. I would have expected to see the oldest truck be way before the value given unless the tool "punts" when it finds a date before its time fence.
Use this information responsibly, and please - no wagering. Feedback from real data scientists welcomed!

I've been watching the Order Tracker for the last week. Hourly when I can, but at least tracking around 7pm and 7am for consistency. Most people are watching the total number of vehicles in a status, but I've been watching the "Average Time" and "Max Time" (which incidentally, the date of the longest vehicle in the Tracker at this status is 4/4/2022 @ ~9pm).
My theory is, when the Broncos that have been there their longest start getting their status progressed, we will see that average time come down at a faster rate than when newer vehicles get pushed through quickly. For example, removing a Bronco that's been in for 1000h drops the overall average, but removing 10 Broncos that have each been there for 100h actually raises the average.
As I said, instead of calling/chatting with Ford for the last week, I've been watching the numbers on really the only tool we really have.
In the attached chart, ignore the stuff on the left, but focus on the green box. For the first time tonight, I saw the average spend time go down for 4h straight. I've seen for down here and there, usually an hour at a time. And if I don't watch it overnight, the data show that the rate of the increase of the average at least slows down.
As of me writing this, the current average Bronco has been in "In Production" status since 4/30/2022 at ~3:00am, so any Bronco sent to shipping before then helps the average go down.
Hopefully this means for 4h, they we getting things out the door that are in the April neck of the woods (my other April compatriots).
Note: my tracker shows "4dr > 6000 lbs Broncos". YMMV. Also, this could be complete BS as I have no idea how the tool calcs the numbers it shows us. And I have no idea how any Jan/Feb/Mar vehicles using the tool would be reflected. I would have expected to see the oldest truck be way before the value given unless the tool "punts" when it finds a date before its time fence.
Use this information responsibly, and please - no wagering. Feedback from real data scientists welcomed!

Sponsored